Origins of complexity and Modal Complexity Factor (MCF)
In classical mechanical engineering problems, the mass, stiffness and damping matrices are often assumed symmetric and yield a real-valued eigensolution of the second order equation of motion. In practice, however, the resultant eigenvectors can be complex-valued due to e.g. non-classical formulation of the damping matrix. In addition, the mode shapes estimated from the measured responses are complex-valued, even for classically damped system, due to finite data length and noise. In the first case the mode shape is complex-valued due to the physical properties of the system, in the latter case due to estimation errors. Note that a complex-valued mode shape is denoted as complex-valued only if it cannot be turned into a real-valued vector by multiplication with a scalar. When analyzing the complexity of mode shapes, the system is assumed to have distinct eigenvalues. Mode shapes corresponding to double modes are linear combinations of some basis vectors and can thus be arbitrarily complex, so complexity indicators like the MCF cannot be directly applied in this case.
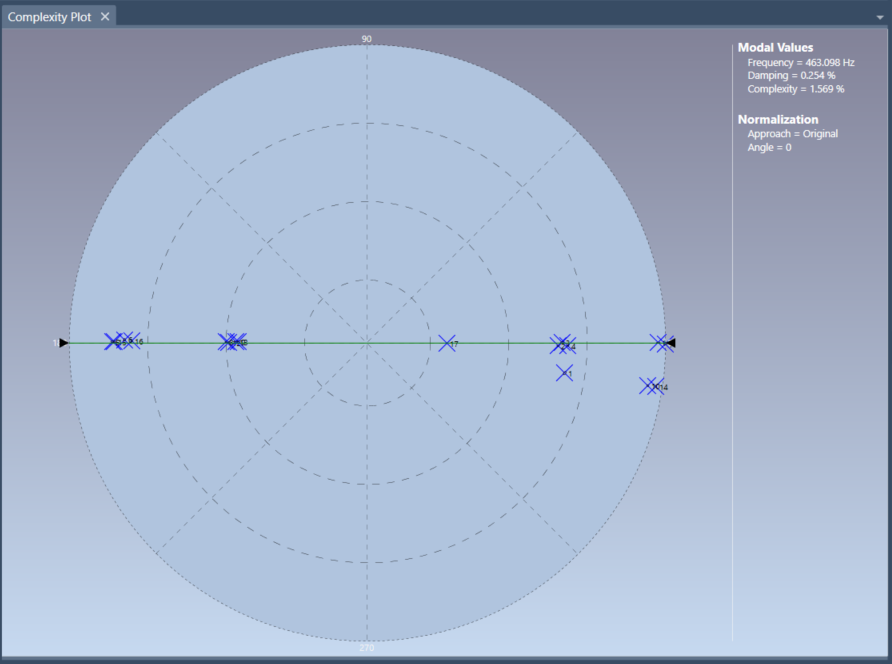
A geometric depiction of the components of a complex mode shape is illustrated on Figure below.
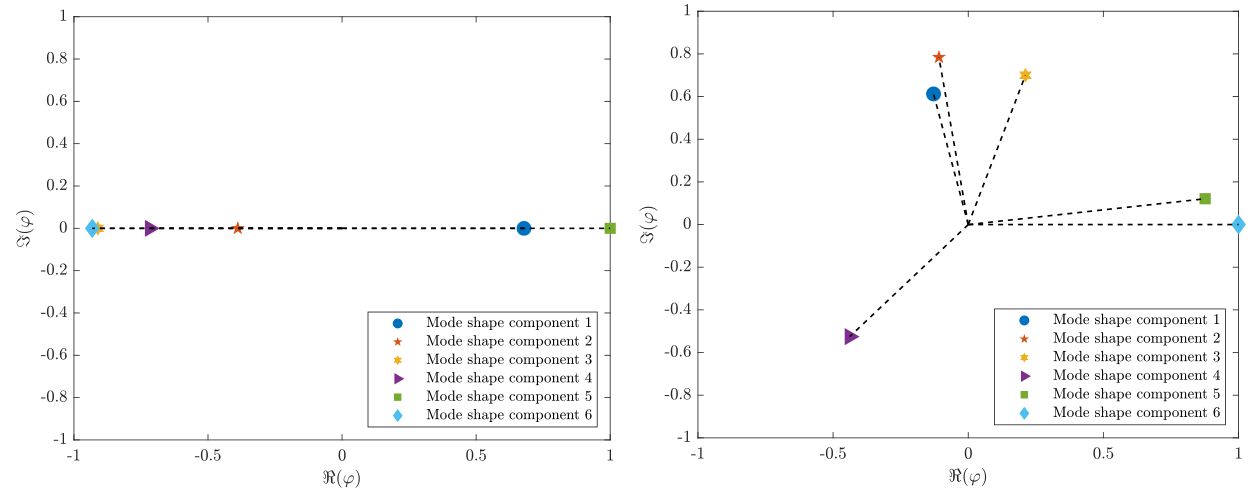
It can be seen that the mode shape components plotted in the complex plain align around one axis and exhibit small imaginary parts for a mode shape with low degree of complexity (left) and show significant dispersion in the complex plain for a mode shape with high complexity (right).
The interpretation of mode shapes estimated from the data is facilitated by so-called modal indicators. One of them is the Modal Complexity Factor (MCF). The MCF indicator is bounded between 0 and 1, where 0 indicates a real-valued mode shape. The higher its value, the higher the mode shape complexity. The expression to evaluate MCF writes
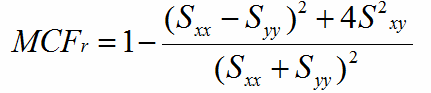
![]()
Thus this value is between 0 (Real Mode) and 1 (Imaginary Mode) and is usually presented in [%]. So for a real mode MCF should always be close to 0%. The value of MCF will increase for one or more of the above reasons:
- Non-proportional damping.
- Finite and noisy measurements or poor modal parameter estimation.
- Inconsistent measurements due to e.g. time variant conditions.
Complexity window
The mode shape components in the complex plane are shown on the Complexity plot.
Each mode shape component is represented by a vector starting in 0,0 and the pointing out to real and imaginary value of its components . If the component is real valued, it should point in an horizontal direction. If the components point to the vertical direction, as on Figure below, it means that the mode shape also has a low complexity, and its components can be arbitrarily rotated around the vertical axis.
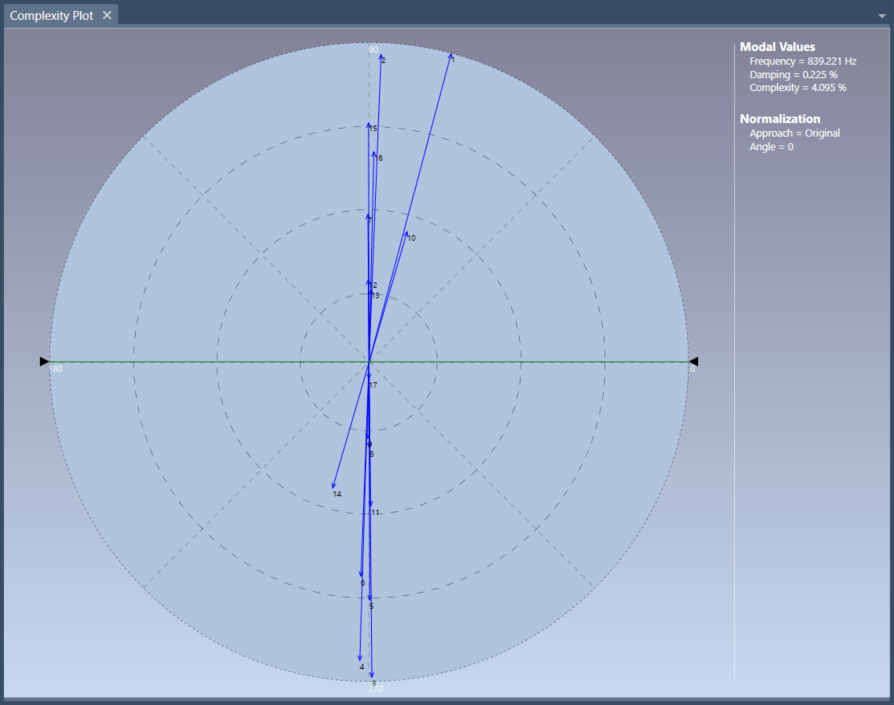
In ARTeMIS Modal it is usually the normalized mode shape that is displayed. In this case a straight line fit is made in the complex plane and afterwards subtracted the mode shape components. In this the mode shape is in a least squares sense force to lie around the real axis. We do this to make sure that any comparison animation of two good mode shapes will be synchronized.
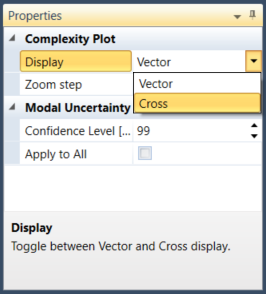
If you like to avoid seeing the arrows you can switch to the Cross Display that only will show a cross indicating the location of the mode shape component.
See below:
Uncertainty illustrated on the Complexity plot and the Modal Complexity Factor
As any estimate from data, the MCF and the underlying mode shape components are perturbed with statistical uncertainty. This uncertainty can be quantified by propagating the variance of the measurements onto the parameters estimates with the first order delta method.
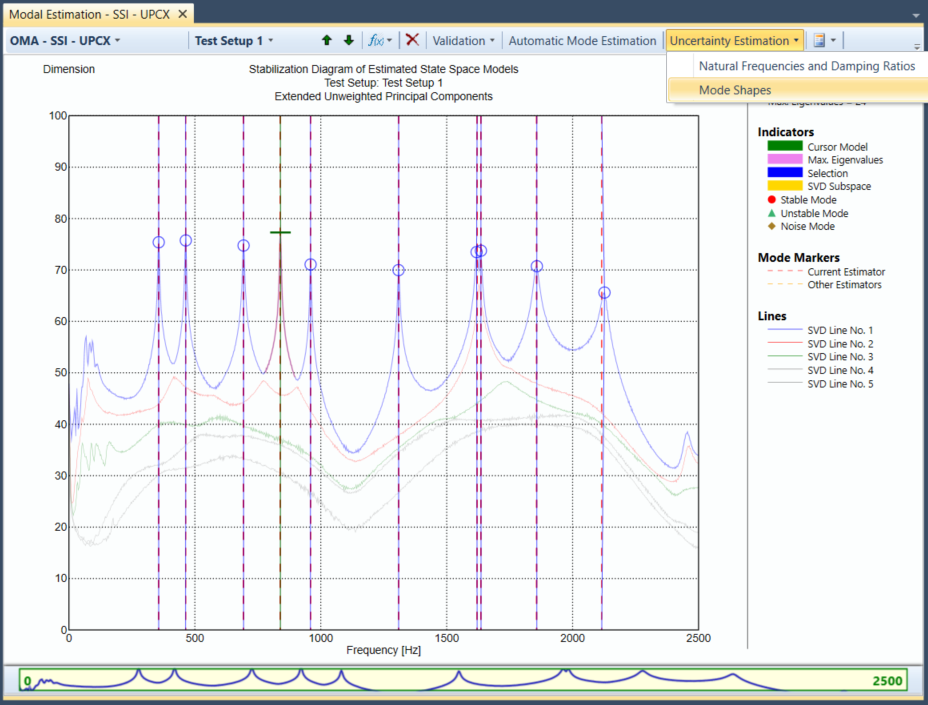
In ARTeMIS, the uncertainty can be evaluated for the estimates of natural frequencies, damping ratios and mode shapes, which is available in SSI-UPCX method.
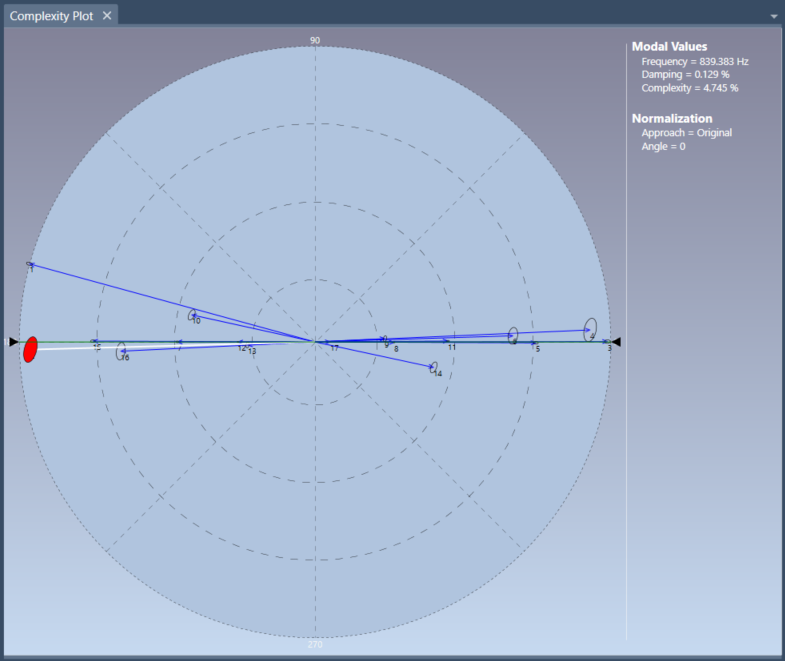
After the mode shape uncertainty is computed, it can be visualized on the Complexity plot as confidence ellipses, which are defined for a confidence level selected by the user in the Properties window, shown earlier. The confidence ellipses are illustrated on Figure below
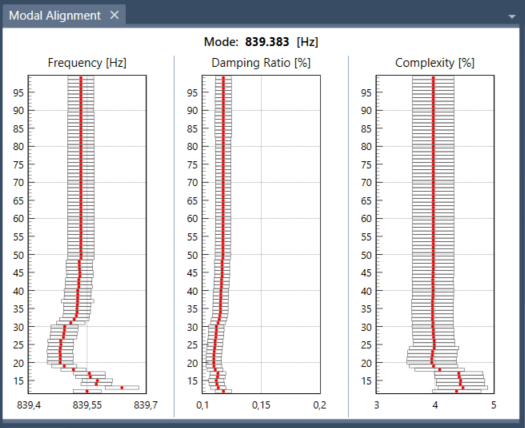
The classic confidence intervals can also be computed for the Modal Complexity Factor, which can be viewed by selecting the Modal Alignment window
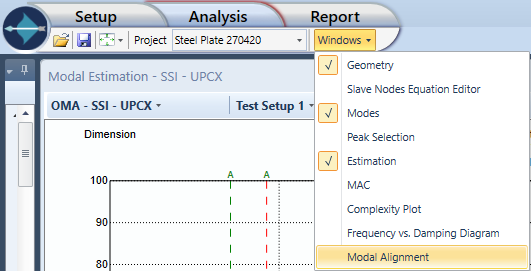
where the modal alignments of the estimates of natural frequency, damping ratio and MCF for the chosen mode are illustrated below
See Also